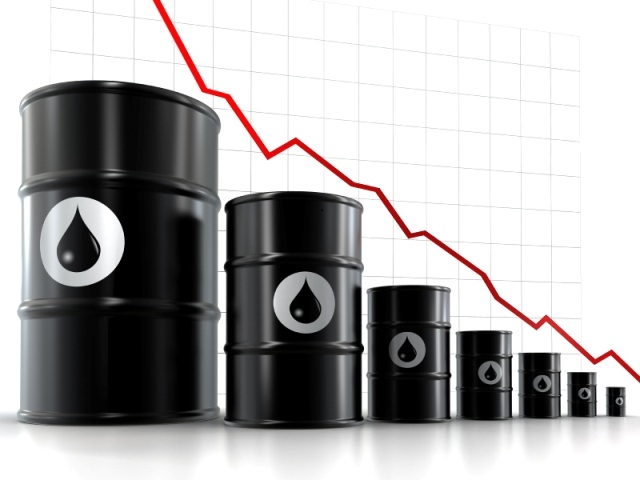
We have forecast since mid-August that Brent oil prices would fall to “$70/bbl and probably lower”, and the US$ would see a strong rise. As Chart 1 shows, Brent has now reached our target, falling 40%, whilst the US$ has risen 10%. We believe this represents the first stage of the Great Unwinding of policymaker stimulus that has dominated markets since 2009. This Note now takes our oil price forecast forward into H1 2015.
Astonishingly, most commentators remain in a state of denial about the enormity of the price fall underway. Some, failing to understand the powerful forces now unleashed, even believe prices may quickly recover. Our view is that oil prices are likely to continue falling to $50/bbl and probably lower in H1 2015, in the absence of OPEC cutbacks or other supply disruption. Critically, China’s slowdown under President Xi’s New Normal economic policy means its demand growth will be a fraction of that seen in the past.
This will create a demand shock equivalent to the supply shock seen in 1973 during the Arab oil boycott. Then the strength of BabyBoomer demand, at a time of weak supply growth, led to a dramatic increase in inflation. By contrast, today's ageing Boomers mean that demand is weakening at a time when the world faces an energy supply glut. This will effectively reverse the 1973 position and lead to the arrival of a deflationary mindset.
CONTENTS Page:
1. Oil prices continue bouncing down the stairs to lower levels. Page 2
2. Financial players have destroyed price discovery in oil markets. Page 4
3. OPEC’s high prices have accelerated move away from oil to gas. Page 5
4. Gulf countries risk losing US defence shield if oil prices stay high. Page 7
1. Oil prices continue bouncing down the stairs to lower levels

Chart 2: Brent prices are now in a steep downtrend
Brent oil prices have reached the “$70/bbl and probably lower” level that we forecast in August. So we now need to think about where they go next. Luckily, Chart 2 above can still guide us, as it has done since September 2010. We first forecast the collapse on 18 August, and then followed this on 27 August with a detailed analysis and specific price forecast:
“How low will prices go? We can have no idea, as prices have never been this high for so long. Nor can we rule out a further massive stimulus effort by the central banks at some point. But "technical trading" logic would suggest they will fall to at least the 200-day exponential moving average, currently around $70/bbl, and probably lower (red line)”.
Unfortunately, conventional wisdom completely missed this move, believing that prices would always stay at $100/bbl. Many companies and investors have lost large amounts of money as a result of wearing these rose-tinted glasses.
WHAT HAPPENS NEXT?
There are 2 parts to the question of ’What Happens Next?’:
- Why is this happening?
- will tell us when the price move is ending?
The “Why” question is easy to answer:
- China’s stimulus policy has ended. Instead, President Xi is moving to his New Normal concept. He intends to improve income levels for ordinary people, not to create wealth effects for a minority via a property bubble
- The US Federal Reserve’s Quantitative Easing (QE) policy has paused. Many investors are preparing to ‘dash for the exits’ just before interest rates rise, as they know prices for financial assets are well out of line with fundamentals
This means that the stimulus policies that pumped air into China’ s demand bubble and the US financial asset bubble have stopped pumping. And a child knows what happens to bubbles when you stop pumping more air – they deflate very quickly. The initial catalyst for this was the unwinding of China’s ‘collateral trade’. As we warned in June, this is now opening the fault lines in the debt-fuelled ‘ring of fire’ created by central bank stimulus.
The “What” question relies on the chart for an answer. We are still in the Great Unwinding phase of these stimulus policies, so we cannot yet rely on supply/demand fundamentals to guide us. Instead, as the chart shows:
- The ‘triangle shape’ extended for 5 years before prices finally fell (red, green lines)
- Prices then collapsed rapidly through support at $90/bbl and $70/bbl (purple)
- $70/bbl was also the 200-day exponential moving average price (red)
- Our August forecast has thus been realised, and prices have indeed carried on falling
We are now in a classic falling formation, bounded by the blue line. We think of this as a rubber ball bouncing down stairs. The ball falls off one stair, bounces to the next, and never quite manages to bounce back to the higher stair. Then it bounces down to the next stair, before eventually reaching the bottom.
Market traders instead call this a “Lower highs, Lower lows” pattern, where sellers continue to dominate. Buyers appear at the lows, but then give up as more sellers appear and sell into the rally. So we will only know when the selling is finished when the price finally makes a ”Higher high” again, and bounces back onto the stair above.
In terms of supply/demand fundamentals, however, little has so far changed. There have been no major production cutbacks or demand increases. As expected, Saudi Oil Minister Ali al-Naimi, wants the market to decide, saying Wednesday, ”Why should we cut production? Why?”. Equally, many developing countries have been busy removing subsidies that supported demand.
It is therefore hard to see what will stop prices continuing to fall towards $50/bbl in H1.
CHINA WILL AGAIN BE KEY TO THE NEXT MOVE
What happens then will be the key question. Geopolitical disruption cannot be ruled out. Russia, for example, might cut gas supplies to try and boost energy prices. But otherwise, the key to the future will continue to be China.
Asian producers and traders now have large inventories of almost every oil-related product. Buyers have simply stopped buying in recent weeks as prices have collapsed. So the question is whether China’s demand will now increase in January, before markets close for Lunar New Year in mid-February. A lot of money is now riding on this issue.
If these hopes prove false, and the West enjoys a mild winter, there would seem little to stop prices heading back towards historical levels of $30/bbl – $40/bbl. This would be good news long-term, as $30/bbl is an ‘affordable’ price for the global economy, at 2.5% of GDP. But it would be very bad news for investments based on the two myths that (a) oil will remain at $100/bbl forever and (b) China’s demand will increase exponentially as it becomes middle-class. Equally important is that a sustained price fall will mean deflation becomes inevitable in the Eurozone and Japan, irrespective of any further QE initiatives.
Financial markets will also be impacted as a new ‘Minsky moment’ develops, and investors suddenly realise, as in 2008, that they have overpaid for their assets and rush for the exits.
The International Energy Agency’s December Report suggests OECD stocks “may bump against storage capacity limits” in H1, and confirms our own fears that we risk “social instability or financial difficulties” in H1. This highlights why we have long feared the Great Unwinding will be a very bumpy road, as we described back in June.
2. Financial players have destroyed price discovery in oil market

Chart 3: Volumes in financial futures markets is now many times physical production.
Oil prices should be set by the balance of supply and demand. But as Chart 3 shows, oil markets have instead become dominated by financial players, as pension and hedge funds decided to buy oil as a “store of value“.
Before 2000, financial market volume (red line) had equalled annual oil production (green). This worked well, providing physical players with sufficient liquidity to enable price hedging to take place. But in 2000, after the dot-com crash, central banks stopped focusing on the need to defend the value of the currency – previously their main role. Instead, they refocused on trying to maintain economic growth. And they began to use their new weapon created in the dot-com revolution, the power to print ‘electronic money’.
OIL MARKETS LOST THE POWER OF PRICE DISCOVERY
Chart 3 shows how this has played out. Unfortunately for all of us, central banks couldn’t resist the temptation to play with their new toy. They came to believe it had near-magical powers, and could control the economic cycle. After the Crisis began in 2008, they even gave it a new name “Quantitative Easing” (QE). And central banks around the world began to use it to print trillions of dollars. Unsurprisingly, of course, this had side-effects.
One was that US pension and hedge funds quickly realised that QE would also devalue the US$. They therefore rushed to invest in oil markets as a supposed ’store of value‘.
What they didn’t realise was that this created a massive imbalance of financial versus physical market demand. Producers couldn’t suddenly double their production at the touch of an electronic button. Financial sector demand simply overwhelmed physical supply:
- Hurricane Katrina in 2005 had already shown the potential for this type of speculation to occur.
- By the time US refineries were operating again after it, financial trading was 4x physical production.
- By 2011, with the support from QE, financial players were trading the equivalent of 6x physical production.
Thus financial market demand came to dominate physical demand, and prices leapt skywards (blue line). The physical market’s key role, that of price discovery, was destroyed [ZH: same as the gold market, incidentally]
Many analysts failed to make the linkages, and instead claimed these high prices were justified by reduced supply or increasing demand. But as we know today, there has never been any physical shortage of oil since the Crisis began. Instead, what is now becoming obvious is that the collapse of the price discovery process led producers to over-invest and create an energy glut.
There are two key issues that will now determine future prices:
- One is that gas has been increasing its market share at oil’s expense.
- The second is Saudi Arabia’s need to ensure the 1945 US/Saudi ‘oil-for-defence agreement’ continues.
We are in for a very bumpy ride, as oil prices return to being based on their own supply/demand fundamentals.
3. OPEC’s high prices have accelerated move away from oil to gas

Does OPEC have a future? Or has it already disappeared as an effective force in oil markets? We are not alone in asking this question. Saudi Oil Minister Ali al-Naimi asked the same question in the summer, suggesting OPEC Ministers should instead meet once a year, and have occasional videoconferences, adding:
“We don’t need a meeting. People come and make nice when at the end of the day, Saudi Arabia carries the burden of balancing the oil market.”
Recent events have shown Naimi meant what he said. He understands that major oil producers need to monetise their product quickly, as it is likely much of today’s vast reserves will end up being left in the ground. This has already happened with coal, after all.
Nobody today worries about the potential for coal shortages set out in the Club of Rome’s famous 1972 Report, ‘The Limits of Growth’ . And the chart above, based on BP data, suggests oil will likely share coal’s fate:
- Consumption of oil (red line) and gas (blue) grew at similar rates from 1965-75
- Both gained market share versus coal in relation to total energy demand (green)
- But OPEC’s high oil prices from 1973-1985 gave a sustained boost to gas demand
- Record oil prices since 2005 have further boosted gas and reduced oil consumption
- They have also reduced OPEC’s oil market share to 42% today versus 51% in 1974

Chart 5: Energy markets are now transitioning from oil to gas.
Chart 5 from ExxonMobil’s 2013 ‘Outlook for Energy to 2040? places these trends in a longer-term context.
- Wood (brown) was the major fuel 200 years ago, but was replaced by coal (orange)
- Oil (green) has since replaced coal, but it is now being replaced by gas (red)
- In 50 years, gas may be replaced by renewables, hydro-electric or nuclear as a fuel
So OPEC faces a future where its product, oil, is now inevitably losing market share to gas. It made a terrible mistake by allowing prices to rise to unaffordable levels in 1974-1985. And since 2005, it has repeated the same mistake.
Energy users have choices, after all. Many have chosen to abandon oil for gas or other fuels. Those tied to oil have reduced consumption by improving energy efficiency.
Even the US has finally moved to adopt European fuel efficiency standards for its auto fleet. Since 1980, US passenger car fuel economy has risen 27%, from 26 mpg to 33 mpg. And this trend is accelerating as today’s more efficient cars replace older models. The standard for new vehicles will be 35.5 mpg (15.09 km/l) in 2016.
Equally important is that most OPEC countries have undermined the oil quota system:
- They have built large numbers of oil-based refineries, as well as oil/gas-based petrochemical complexes
- Those using oil effectively increase the country’s oil exports beyond its official quota
- Those using gas increase its total energy exports, effectively cannibalising oil’s share of the energy market
Naimi has another reason for abandoning OPEC today, namely the growing geopolitical threat to Saudi and the other Gulf Co-Operation Council (GCC) countries. The GCC are surrounded by potential enemies, all of whom would like a share of its current oil wealth.
In these circumstances, they cannot possibly continue to allow high prices to destroy the rationale for the US defence shield on which they have depended since 1945.
4. Gulf countries risk losing US defence shield if oil prices stay high

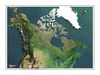
Chart 6: Canada now exports more to the US than OPEC
A version of Chart 6 must have been keeping ministers awake at nights in Riyadh and other Gulf Co-Operation Countries (GCC) in recent months. “How did we allow Canada to supply more oil than OPEC to the US?” they worry. ”What did we think we were doing?”
This might not be quite so critical if the GCC was able to defend itself militarily against its enemies. But Saudi Arabia, the main GCC country, has a population of just 27 million. The total population of the other GCC countries is just 23m. And they all remember very well what happened in 1990, when OPEC-member Iraq decided to invade GCC-member, Kuwait.
It wasn’t Nigeria, or Venezuela or Libya or another OPEC member that came to their rescue then. It was the USA, under the long-standing 1945 oil-for-defence deal agreed by President Roosevelt and King Saud. Roosevelt had needed Saudi oil to rebuild the US after World War II, and Saud needed someone to fight off his enemies.
Now, fast forward to today. Can one imagine President Obama and Congress putting US armies into a modern-day Operation Desert Shield/Desert Storm? Or UK Prime Minister Cameron rushing to persuade the President to do this? Of course not. But Margaret Thatcher did in August 1990, telling President Bush “This is no time to go wobbly”. And Congress agreed, as we all knew we needed friendly regimes in Riyadh and the GCC.

Chart 7: GCC exports to the US are falling as Canada’s increase
The second chart highlights the key message. Of course, it wasn’t OPEC’s fault that oil prices went back to record levels over the past decade, as discussed in section 2. But they allowed it to continue, instead of increasing supply post-2008, and collapsing the whole charade. Sadly, they preferred to believe the story that the world could now live with $100/bbl oil - though it had never done so before, and they forgot that high prices encourage new supply:
- GCC oil exports to the US had historically been on a rising trend (purple line)
- But their volume peaked at 2.5mbd after 2004, and now risks falling below 1.5mbd
- Canadian imports have instead been rising from 1mbd in 1993 to 3.5mbd today (red)
- And Canadian volumes are continuing to rise, whilst GCC volumes fall
So what would happen today if the Caliphate or someone else decided to attack? After all, the GCC countries are immensely wealthy after a decade of high prices. Would the US, UK and other countries come to their rescue again?
The GCC countries have clearly woken up to this critical issue, that their position is extremely vulnerable without US support. This have suddenly begun to plan their own oil price strategy, independently of OPEC. Instead of agreeing to production cuts, Saudi Oil Minister Naimi has said that in future, “the market sets the price”.
* * *
Prices have so far fallen $40/bbl from $105/bbl since we first argued in mid-August that a Great Unwinding was now underway. And there have been no production cutbacks around the world in response, or sudden jumps in demand. So prices may well need to fall the same amount again, before GCC leaders can once again sleep easily in their beds at night.


Laissez un commentaire Votre adresse courriel ne sera pas publiée.
Veuillez vous connecter afin de laisser un commentaire.
Aucun commentaire trouvé