Main findings:
- US debt-to-GDP to reach 140% by 2024
- Net increase in debt could be as enormous as $10 to 15 trillion in just five years 2019 to 2024
- Federal budget interest expenditure could reach $1.5 trillion by 2028, 25% of the total
- There has been no real GDP growth since at least 2007
- Growth of government debt has exceeded even nominal GDP growth multiple times each year since 2007
- US reporting on national debt and inflation full of tricks
- War budgets ripping open huge deficits
- Skyrocketing social spending leaves no room for deficit cuts
- Unfunded liabilities now a reality as Social Security and Medicare funds dry up
US economy about to implode following the two-decade long debt binge
Two decades of debt-fueled sham growth, creative accounting practices and war spending has pushed the US economy to the brink. It is therefore doubtful whether the already exhausted US economy can bear the additional stress from the massive drive to expand the US global hegemony, the increased confrontation and arms race with Russia and China, as well as the incipient trade war with China. Most probably it can’t.
The already enormous US debt-load is ballooning as the government borrows trillions to keep the economic bubble in the air and to imitate growth. The US federal budgets for 2018 and 2019 and the 10-year projection will create huge deficits adding yet more debt to the tune of a trillion dollars per year – per official projections – until 2023. Our analysis shows that the actual borrowings might vastly exceed that, inflating the debt balloon by $10 trillion, or more, in just five years, and reaching 140% of GDP by 2024.
But new global economic realities have clouded the prospects of the US being able to count on continuous low-interest financing of its deficits. Following predictions of mounting debt and interest costs, even the government has factored in an almost 150% rise in annual interest expenditure by 2028, reaching $760 billion. We predict (concurring with other analysts) that the interest expenditure is very likely to actually swell twice as much and reach an annual $1.5 trillion by 2028. That’s a totally unsustainable level, and even double the size of the sacrosanct war budget for 2028 (as per the government’s 10-year plan). $1.5 trillion on interest would mean about 25% of the total budget, compared with 7% in 2018. There is no way that the US economy can afford that cost. But because of skyrocketing social costs and the war budget priorities, the budget offers no flexibility, even when everything else is being thrown overboard.
In view of this, it is clear that the present US economic system will not survive over the coming 5 to 10 years. Massive changes in the economic model would have to be undertaken either in an organized fashion (hardly imaginable) or through a mega financial crisis. Ultimately this would lead to a permanent downgrading of US standards of living as the economy would have to adjust back to its pre-financial bubble level of $14.5 trillion (a 30% drop from present debt-fueled level). Following these cataclysmic adjustments, the US would lose its economic hegemony and hegemonic military power. This would give a per capita GDP of just above $30 thousand, almost on par with Russia’s present $28 thousand per capita.
There has been no real GDP growth since 2007
We argue that there has been no real GDP growth since at least the 2007 – 2008 crisis – and most probably since 2000 when the tech bubble burst. The semblance of growth has merely been created by way of massive borrowings in all sectors of the economy: public and private, corporate and household. Starting with the deregulation and liberalization of the capital markets (and the speculation it entailed) in the late 70s and 80s debt growth accelerated above growth of the underlying economy and really shot off in the wake of the two financial market crises. (Table 1). An even earlier turning point be can be identified in 1971 when the U.S. abandoned the gold standard. Whereas, the size of the debt historically corresponded to the size of the underlying economy, the level of US total debt (public and private) is now 3 times higher than the GDP.
After the 2007 financial crisis, households lost their capacity to rack up more debt, but since then the government as stepped in to make up for the shortfall with its colossal borrowings in order to keep the economy floating. Table 2 illustrates the precipitous rise of national debt (government debt) over the GDP since 1980 – beginning of market liberalization – and again after 2000, in the wake of the tech bubble crisis.

In fact, the US government debt is higher than what is shown in the above graph. This is because contrary to global practices, the US only reports the debt of federal government failing to report debt of states and municipalities (local debt). With local debt, the US debt-to-GDP ratio would be 125%, which is the correct indicator for global comparisons.
In addition to that reporting fallacy, the US government also has a peculiar habit of knocking out a third of the debt when it reports the figures of so-called public debt instead of the total national debt. By public debt they mean debt held by the public as opposed to intra-government debt, whereas the term public debt in global practices is a synonym to national debt (and government debt, too). Most often in the American discussion only this perverted public debt figure is reported, thus ignoring 40% of the actual debt.
Growth of government debt has exceeded GDP growth manyfold
Not only has there been no real GDP growth but even the nominal growth has to a crucial extent been provided for by means of the enormous government borrowings. Below table shows that that in each year 2008 to 2017 even the nominal GDP growth has been less than the growth of government debt.
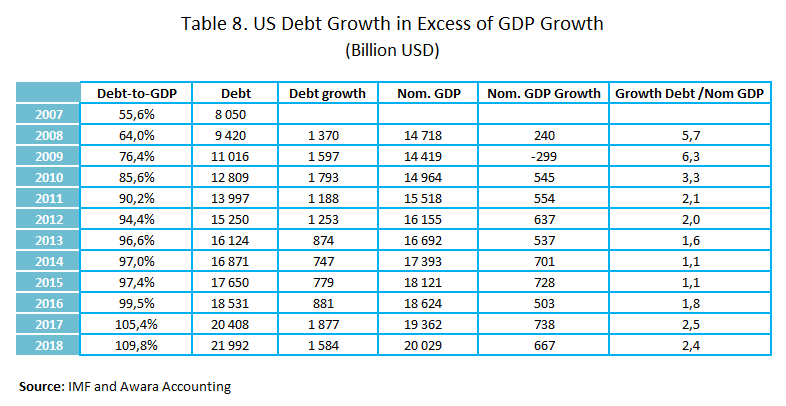
In every single year since 2007 up till now the amount of new debt has exceeded the nominal GDP growth. In the peak crisis years 2008 and 2009, debt growth was a staggering 5.7 and 6.3 times that of the GDP growth. In all other years, debt growth remained at levels of two times the GDP growth, except 2014 and 2015 when they were on par.
US government cooks the books
We wrote above that the US government has been rather cavalier with its practices of reporting the size and structure of national and public debt. But the creative accounting practices do not stop there. They have actually tampered with (aka “reformed”) the methodology of how inflation is measured in order to underreport actual inflation rates. By undermeasuring inflation, the government has been able to overstate GDP growth by means of reclassifying price inflation as supposed qualitative and quantitative improvements. Paul Craig Roberts has written about these dubious practices here and here.
The bottom line of this is that we cannot trust the US government figures on inflation and by implication its GDP growth figures. John Williams’ Shadow Government Statistics has calculated inflation according to the methodology, which was employed by the government’s Bureau of Labor Statistics prior to 1990, before all the tricks following the “reforms” came to use. These alternative inflation statistics indicated that the actual inflation was about 2 percentage points above the officially reported up to 2007, after which the gap widened to a persistent level of 4 percentage points.
US economy resembles a giant Ponzi scheme
It is fair to say that very little of the enormous debt load has gone into productive investments for the future, and instead has been wasted in momentarily consumption and on costly overseas wars and subsidies to the military-industrial complex. An enormous bubble has been created – and it will go on inflating as the new debt must not only be high enough to maintain the bubble at the previous level but also high enough to generate a semblance of growth. It is exactly like in a Ponzi scheme where constantly more money is needed to build up the asset scam while paying off the earlier investors. The latter corresponds to consumption waste but also to corruption rent in form of pay-offs to the elite stakeholders, the so-called One Percent. This is precisely the reason why the richest 1 percent bagged 82% of all new wealth created in 2017 and the poorest half of humanity got nothing.
War budgets ripping open huge deficits
As if that wasn’t bad enough, the future promises to be worse thanks to the recent budget-busting tax cuts and spending deals. This March the US national debt soared over the $21 trillion mark, only weeks before the Congress passed its record $1.3 trillion discretionary budget bill for fiscal year 2018 with a record $700 billion for the military-industrial complex.
But a far scarier reading is Trump’s budget for 2019 and the ten-year projections which came with it. Even though these budgets rely on extremely optimistic and unrealistic economic growth assumptions they foresee enormous deficits to the tune of $1 trillion for each year up to 2023. There is then the wishful idea that after 2023 there would supposedly be a turnaround leading to shrinking deficits and only 1.1% budget deficit by 2023.
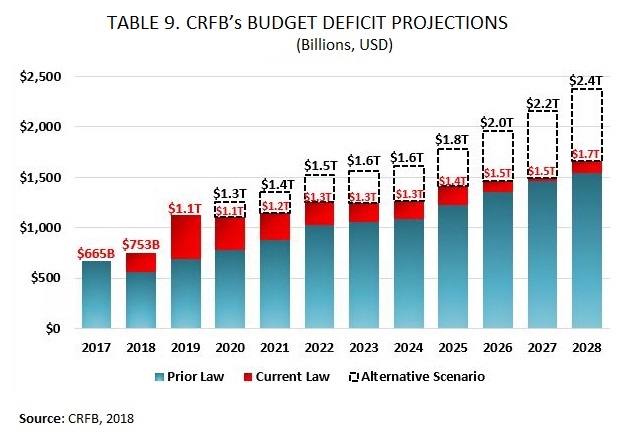
That is not going to happen. On the contrary, the actual deficits will be even higher. The independent think than Committee for a Responsible Federal Budget forecasts that not only will there be any turnaround in deficit growth but the deficits will continue to grow at a crazed rate reaching an annual $2.4 trillion by 2028, which is closer to 7 times higher than the official prediction. Cumulatively over the 10 years, the CRFB projections would add $10 trillion to the debt over the government’s forecast.
We think that the future prospects are even gloomier than that. As we showed above, the US government has continuously been racking up new debt even in excess of the nominal GDP growth, borrowing more than needed to patch up the annual deficits. We therefore, assume in our baseline scenario that the US government’s annual net borrowing needs will exceed the nominal GDP by 3%. This would mean that the net increase in debt could be as enormous as $10 to 15 trillion in just five years 2019 to 2024. Such massive borrowings would spell ruin to the economy.
Unfunded liabilities will now become due
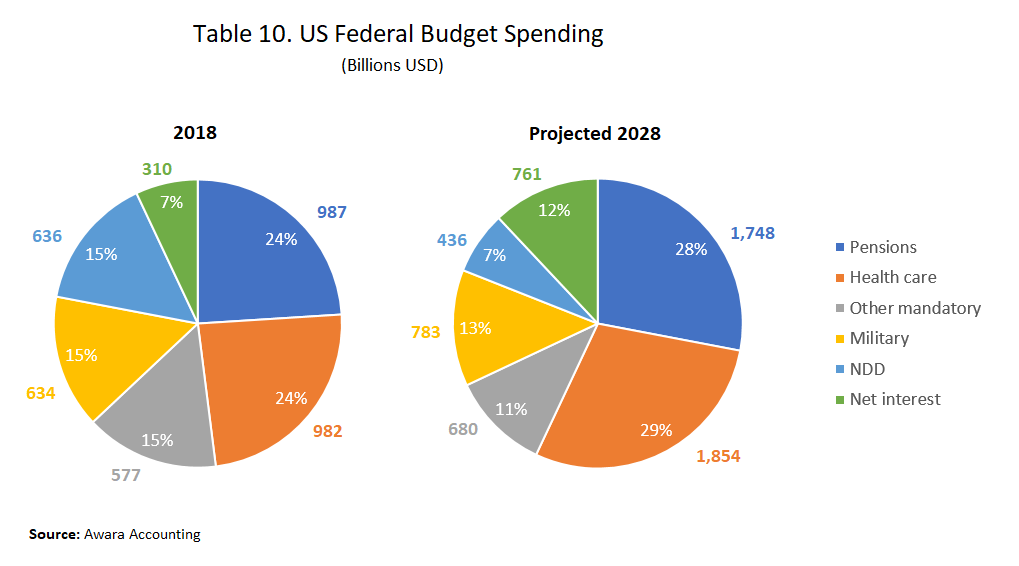
While military spending makes up a huge and growing share of the federal budget, it is actually social spending (pensions, health care), which forms the biggest portion of the present budget and will grow vastly more than the military spending according to the 2028 projections.
In the 2018 budget, pensions (Social Security) accounted for 24% of the total or $987 billion, whereas they now are projected to grow by 77% to reach $1,748 billion by 2028 with a share of 28%. The health care costs (Medicare) with a present share of 24% worth $982 billion would in the same time jump by 89% to $1,854 billion, a share of 29%.
The ballooning social security and health care costs will not come due to some newfound social inclinations in Trump’s way of thinking, rather there is no choice. The Medicare trust fund is projected to run out of money in seven years, Social Security Disability in five, and Social Security retirement in 12, according to the nonpartisan Congressional Budget Office.
Economists have calculated that the value of the unfunded liabilities on Social Security and Medicare range anywhere between $46.7 trillion to $210 trillion. The calculations are based on assessing the difference between the amount of the present value (their discounted value as of today) of all benefits which will have to be paid out in the future years and the present value of the projected tax revenue designated to pay for those benefits. It is worth pointing out that the $46.7 trillion unfunded liabilities figure is not based on just any economist’s alarmist calculations but actually comes from the official Financial Report of the US Government for year 2016 compiled by US Department of Treasury.
The government cannot any longer count on dipping into Social Security to continue funding its deficits when it instead must pump in more money in the system. There is very little, if any, leeway to cut spending as it, on the contrary, would have to be stepped up.
As a result of the decade long zero-interest debt binge, private pension plans have lost in value and cannot alleviate the problem either. (One of the big reasons why interests must be raised).
In addition to these skyrocketing social and health care costs there is the projected exorbitant interest expenditure, and of course the military budget. In order to scrape together a budget with presentable deficits, the Trump administration has projected only a 25% increase in military spending over ten years, from $700 billion in 2018 to $783 in 2028. Of course, that will not happen, so the actual spending on the military will rip open ever wider deficits.
Then, as reported above, the exorbitantly rising interest costs will deliver the final blow to the US budget – and the whole economy
Why the US cannot keep printing money
Frequently, a discussion on the dire prospects of the US economy and its debt problem ends with the prediction that the Fed will just keep financing it by purchasing treasury securities (aka quantitative easing aka money printing). But in reality, that is not an option. The Fed’s recent interest hikes from the lows of 0.25% to 1.5% – 1.5% show that they have realized that the economy cannot permanently function in an administratively decreed zero-interest environment.
The Fed may have already caused permanent and fatal damage to the US economy by organizing the decade long zero-interest debt orgy. The US economy has been turned into a giant bubble economy detached from all fundamental market mechanisms. It is even doubtful if the United States can still be called a market economy. In a real market economy, it would never have been possible to press by fiat the interest rates down to zero without the other components of a financial system – currency exchange values, inflation, risk premiums – reacting in different directions. In actual fact, it has not been possible in the US either, the complications – as we have seen – have been building up and have now reached the near breaking point. Fed financing has stoked the asset bubbles with misallocated credit that has been used for financial speculation and corporate stock buyback.
The US has got away with it for nearly two decades thanks to the strong starting point and by means of manipulating the dollar currency monopoly. The latter, as all monopolies, has been a deceptive advantage: it has enabled the US to live above its means for decades, but now the bill is getting due. In the American form of planned economy, the Fed has functioned like a central planning organ similar to the USSR State Planning Commission, the Gosplan, with the difference that it has not strived to set the prices of each and all goods and services separately – as it was in the planned economy of the Soviet Union – instead it has fixed the price of the most important of all goods, namely the price of money, by administratively decreeing the interest rates without regard to market mechanisms, coupled with a manipulation of currency exchange rates.
No economy can perpetually ignore the laws of market economies. The USSR did it until it failed, China did it, until it embarked on its astonishing economic recovery. The Americans, too, will soon have to refresh all they used to know about the fundamentals of market economy.
Other creditors will demand interest
It is hard to imagine that the bulk of the funding of the gargantuan borrowings could come from anybody else than the Fed (directly or indirectly). But as we have seen, it is also highly unlikely that they could continue doing so to those exorbitant levels and below real market rates. The viability of the US economy will require that the conditions of market economy are returned, and in particular the pension bomb requires that pension savings plans get a sufficient yield.
With these borrowing needs, the Fed could not possible continue this extravaganza without the risk of hyperinflation becoming very real. Therefore, the US must be able to attract funding on market terms from domestic and foreign sources, which requires market-based interests. The incipient trade war with China and Make America Great Again protectionism will inevitably raise inflation rates. While inflation, as we report, has been substantially higher than what the government wants us to think, it has anyway been low in proportion to the massive debt leverage. Instead real estate and stock prices have inflated and sucked up the pressure. With present levels of the asset bubble this cannot go on perpetually either and therefore the inflation will inevitably be felt in consumer prices. Also, these levels of share prices will push the corporations to raise the prices of their products, as they have to try to show revenue proportionate to their share prices.
At the same time foreign funding is drying up as countries like Russia are striving to de-dollarize their economies and foreign trade, and China is working on establishing itself as a world financial power, establishing its own benchmark quotes for commodities such as gold and attempting to dethrone the petrodollar with its petroyuan.
For further reading on how the dollar currency monopoly and Fed’s zero-interest financing has distorted the markets and created actual inflationary problems we recommend our earlier study titled How the dollar and euro monopolies destroyed the real market economy. And what Hayek told about the need for competing currencies.
Below we will provide more details and corroboration to our findings.
DISCUSSION AND CORROBORATION
US economy excessively debt-fueled since 1980s
Ever since the tech bubble burst in 2000 and increasingly in the wake of the global financial crisis in 2007 – 2008, the US economy has been kept afloat solely by means of massive borrowings in all sectors of the economy: public and private, corporate and household. Starting with the deregulation and liberalization of the capital markets (and the speculation it entailed) in the late 70s and 80s debt growth accelerated above growth of the underlying economy and really shot off in the wake of the two financial market crises. (Table 1). An even earlier turning point be can be identified in 1971 when the U.S. abandoned the gold standard. Whereas, the size of the debt historically corresponded to the size of the underlying economy, the level of US total debt (public and private) is now 3 times higher than the GDP.
 The 2007 crisis was actually triggered by the household sector reaching the absolute limits of debt binging. After those cataclysmic events household share of total debt has slightly declined, but to keep the economy floating the government has stepped in with an endless appetite for new debt. Direct government borrowing comes in fact only as a continuation of the same government policy which encouraged the private debt orgy. The Fed and the government had encouraged and facilitated easy-access and low-interest financing for the private sector in order to turnaround the stock markets and create growth in the wake of the tech crisis. Fueling the economy with debt was a deliberate policy. And just like the case of a drunkard, the idea was to take a shot of debt to cure the hangover but then the whole economy got hooked on the bottle.
It is fair to say that very little of the enormous debt load has gone into productive investments for the future, and instead has been wasted in momentarily consumption and on costly overseas wars and subsidies to the military-industrial complex. This is the reason why the debt will have to keep growing as long as the US elite is bent on keeping the present economic and social model and their world hegemony project alive. An enormous bubble has been created – and it will go on inflating as the new debt must not only be high enough to maintain the bubble at the previous level but also high enough to generate a semblance of growth. It is exactly like in a Ponzi scheme where constantly more money is needed to build up the asset scam while paying off the earlier investors. The latter corresponds to consumption waste but also to corruption rent in form of pay-offs to the elite stakeholders, the so-called One Percent. This is precisely the reason that the richest 1 percent bagged 82% of all new wealth created in 2017 and the poorest half of humanity got nothing.
US government cooks the books
With an expected debt-to-GDP ratio of 125% at the end of this year, the US is now just behind Italy as the world’s third most indebted major country, and far above Spain and France with their near 100% debt ratio. Still the future looks yet bleaker as we expect the US debt to grow to $30 trillion within five more years, by 2023. The US debt ratio would then be 140%.
For most consumers of economic news, these figures might sound bewildering. But that’s just because you might not know that the US government has been cooking the books. To put it somewhat milder, the US government – (exceptional as they are) – is so to say creative in reporting its debt figures, or at the very least they don’t follow the conventions that apply to the mere mortal countries, that is, to the rest of the world.
We find fault on several levels. It starts with the definition of Government Debt (also referred to as National Debt, and Public Debt). By generally accepted and applied standards of national accounting government debt is defined as the debt of all levels of government: central and federal government, states (counties etc.), cities and municipalities. And that’s how the rule-abiding countries report the national debt by lumping together all the debt from all of the three tiers of government. But not the United States. The US reports only the debt of the Federal government, leaving the states and municipalities out (local debt). The figures look much prettier that way. But let’s look at the ugly truth. By end of 2018, the US federal debt is expected to be $22 trillion, but $3.1 trillion more comes from states and municipalities, $1.2 trillion and $1.9 trillion, respectively. This brings the total to $25.1 trillion. Actually, the international standards would require that the debt of federal agencies and government sponsored enterprises would also be recorded in the national debt. For the US this would mean yet some $9 trillion additional debt bringing the total further up to $32 trillion.
Precisely due to the opaque reporting practices of the US government, the local debt (states, cities, municipalities) is not readily available, but from various sources we have gleaned figures which sound believable. The figures we got are from this online resource monitoring US debt. We have found further corroboration for these figures in a Congressional research paper from 2011. See also this article.
The cited sources refer to data from 2010-2013, therefore for all we know, the real figures on local debt could be much higher. On the other hand, it could be that the states and municipalities really are in such dire straits that they just cannot raise new debt, especially when the federal government is sucking in all available funds like a juggernaut feeding on greenbacks. After all, the cumulative total of $3 trillion for all the 50 states, the megacities, and all the other municipalities does not sound so much, certainly not in comparison with the debt the federal government has racked up. Maybe this is also why the local government has no funds to repair and replace the crumbling infrastructure across the country?
Table 3 shows the debt-to-GDP ratio of a sample of countries. The US figure has been adjusted to show the estimated ratio at the end of 2018 including the local debt (states and municipalities) which never shows up in global comparison of US debt although that is the case with other countries.
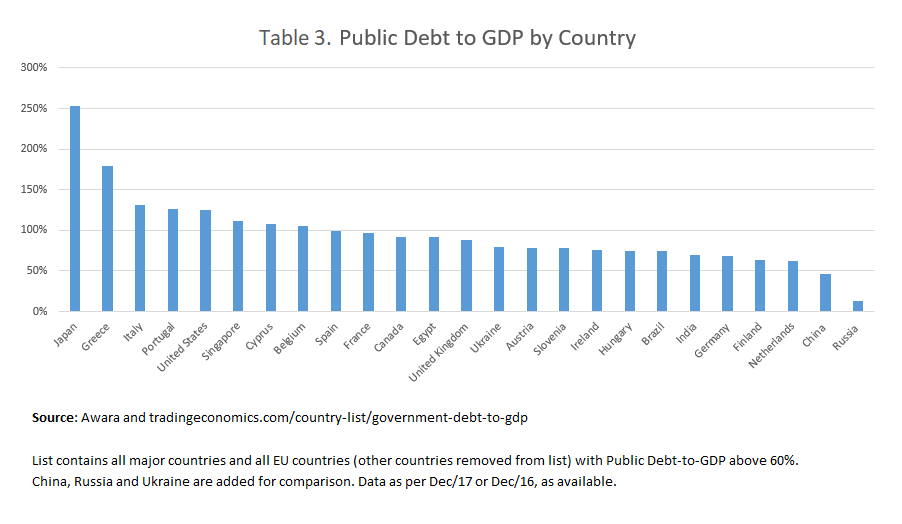
It is remarkable that Russia’s government debt ranks lowest of all major countries and 166th of all the 171 countries surveyed. China is also well behind the United States and all the other major Western countries, ranking 75th.
The US reports public debt differently from all other countries
In addition to the discrepancy between the US government debt (public debt, national debt) figures and that of most other countries, there is another anomality insofar as the term public debt has an exceptional meaning in the American parlance. In global practice, public debt is synonymous to government debt and national debt, but in the United States the government debt is correctly referred to as national debt but the concept public debt only refers to the portion of government debt held by the public in the sense of private individuals, corporations, funds and other investors, including also foreign governments and investors. It so happens that in addition to the so defined public also US intragovernmental entities – such as the Social Security Trust Fund – hold part of the national debt. The public holdings and intragovernmental holdings make up 57% and 43% respectively.
There is absolutely nothing principally wrong with that kind of statistical classification of debt holders, but what the US government does – to make the stats look prettier – is that it tends to ignore the intragovernmental holdings and chooses to give publicity in its reporting only to the figures concerning the part of the debt held by the public.
Apart from the figures looking prettier that way, we can see, that the original logic behind this idea was the consideration that what the government owns to other parts of the government really isn’t debt, as you can’t kind of own to yourself. But this does not really hold water, first of all it skews the global comparison and obfuscates a true and fair presentation of the health of government finances. Moreover, the logic according to which intragovernmental debt would be less a debt is faulty in its fundamentals. See, the government agencies are out there to serve the people, for that they accrue liabilities, and for the liabilities they must have funds. The funds that they have lent out to the federal government must thus eventually be returned so that the agencies can meet their liabilities towards the people. So, at the end of the analysis that money is also owned to the public, the government agencies only serving as intermediaries. This problem is very real and acute, as the Social Security, Medicare and other government social funds are drying up and dipping into huge deficits, materializing the worst scares of deficit hawks about unfunded liabilities. (Discussed below). This will lead to enormous growth in social spending, which shows that the federal government really will have to return the money, or at the very least that it cannot further rely on those intragovernmental sources to plug its deficits.
Who are America’s biggest creditors
Table 4 shows the biggest creditors of the US federal government as per 12/2016.
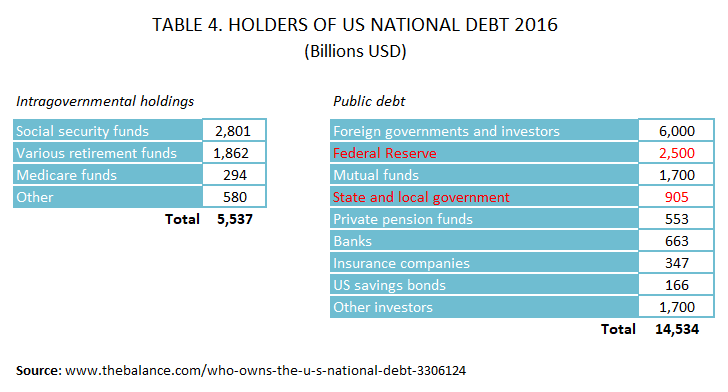
We note that in the above table the holdings of the Federal Reserve and state and local government are recorded in public holdings. As the Federal Reserve is the US central bank it is quite a stretch to record its credit in public (if you need that distinction in the first place). Same goes for state and local creditors. We may therefore adjust the figures by putting those holdings in relevant categories, which would show that of total debt at the end of 2016 the intragovernmental holdings amounted to $8,590 billion or 43% and the public debt to $11,481 or 57%.
Which foreign nations hold US government debt
Table 5 list the major foreign holders of US debt (treasury securities)
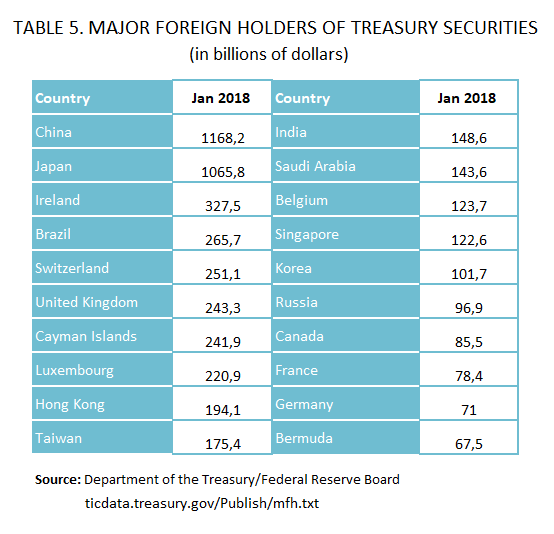
This data on foreign holdings might not represent the complete picture, as several foreign actors have their assets onshore in the US and act through US registered investment vehicles as well as through offshore tax havens (e.g. Ireland, Cayman Islands, Bermuda). It has been reported that US corporations and investors also have major holdings through their offshore vehicles.
One remarkable fact is that two countries, Japan and China, overwhelmingly lead the table by wide margins over the other countries. The connotation of this is that the US would need to attract their continuous interest for gobbling up the ever-growing US debt. But, neither of them might have the capacity for it, even if predisposed to do so, but with the recently initiated trade war with China, the Chinese might just have lost their appetite for US debt altogether. In fact, although China’s total foreign reserves have risen well above the $3 trillion mark, their holdings of federal debt have stayed put at the level of $1.2 trillion since 2013. (It is not quite clear where the difference has gone, but it is assumed that China might manage its reserves also by investments in corporate bonds and stock exchanges). The same holds true for many other countries in the world, like Russia, which has made an effective pivot to China. Chinese assets will now seriously compete with the Americans in wooing global investors. There are then both deliberate geopolitical concerns diverting assets away from US debt as well as market-based investor preferences.
With less foreign interest towards US debt, the government will have an increasingly hard time to patch up its fiscal deficits. One must bear in mind that the question is not even about China or other countries making dramatic moves to reject US debt or sudden swings in investor preferences, rather it is a question about trends building up incrementally over the years. But considering the enormous deficit financing needs of the US government and anyway marked tendencies in a shift towards China and other overseas markets, the incremental changes might spell a catastrophe for the US already within 5 to 10 years. This then would entail significant interest rate hikes further ripping open the deficits and also forcing the Fed again to ramp up its purchases of government debt. The Fed could then – in view of its money printing powers – obviously bring down the interest rates by not demanding an interest or a very small one on its purchases. But lower interest rates would in turn scare away other investors (savers), gradually leading to a situation (like in Japan) where the Fed is the sole buyer of US government debt.
The US economy might not have had any real GDP growth in a decade
There’s another fundamental weakness with the US debt-to-GDP figures – it could be that the entire GDP edifice rests on feet of clay. It is entirely plausible that there has not been any real GDP growth since 2007 and that all semblance of growth has been created by fraudulent accounting of the national economy and massive new borrowings. In each year 2008 to 2017 even the nominal growth in GDP has been less than the growth of government debt.
Paul Craig Roberts has been reminding from time to time that the US government is in the habit of underreporting inflation due to their measurement biases. The ramifications of persistent undermeasurement of inflation is the overstatement of GDP growth. GDP measures the total output value of all goods and services produced in a country, and the GDP growth figure strives to capture the change in that output. Primarily a higher total (nominal) value would mean a higher GDP, that is, GDP growth. But part of the higher value does not actually correspond to any increase in the amount of goods and services produced representing only a price increase, that is, inflation. Therefore, to capture the real GDP growth the increase of the GDP values are discounted by the inflation rate. For example, if nominal GDP rises 5% in one year over the previous year, and the inflation rate is 2%, then the real GDP has grown by 3%. The 3% growth would then represent the amounts of increased output of actual new or qualitatively improved products. The notion of qualitative improvement is another problem as we shall see below.
The challenge here is that you must start with getting your inflation measurements right. The objective problem is that not all price increases are inflationary in the sense of the same thing just getting more expensive for no visible reason. Some price increases are motivated by the improved qualities of the product (think about comparing a car of the 1980s and one of today) or by a product having been replaced by another for performing a similar task (a type writer exchanged for a computer). It’s objectively difficult to keep track of all the different reasons for price changes.
But very often an alleged qualitative improvement might not in reality be one (a change of package and other marketing tricks). All corporations employ marketing people whose job it is to precisely create the fiction that their products are constantly improving to motivate the price hikes. That’s understandable, but the problems really start when the government agency tasked with the measurement of inflation willfully exploits those fictions in order to claim that a big part of all price increases have not been inflationary and merely represent perpetual improvements in the goods and services that the brave new national economy produces. If we are to believe Paul Craig Roberts (op cited) – and we for sure do – then that is precisely what the US government has been doing. Essentially, they are claiming that a grand part of all the price hikes in the US over the last decade or so are just due to the products becoming perpetually better and better as devised by the brilliant engineers and innovative economy of the United States. Following this logic – for example – they may contrive to declare that of the 5% measured inflation only 1% was actually unmotivated price inflation and 4% represented qualitative improvements or increased volumes. This chain of reasoning would then leave the country with a 4% GDP increase, although no actual increase may have taken place at all.
But that’s not all, as Paul Craig Roberts reported, the government’s creative inflation accounting does not stop there. The government actually “reformed” the system so that they now altogether disqualify from inflation measures some of the products whose prices have gone up and substitute them with a cheaper product, effectively this time around they are downgrading the quality. The lying logic behind this is that when prices go up (without a corresponding increase in income) consumers downswitch to cheaper products (e.g. substitute beef with chicken) and therefore as a result the consumers would not spend any more money than earlier, because they don’t have it – but for the government it’s all the same. We all know that the quality of products may also deteriorate just because the manufacturer switches to cheaper materials and less qualified labor (and other such reasons), but all these adverse changes of course go unnoticed by the otherwise all-seeing government. What transpires is that for the government quality improvements – real and imagined – are a big plus for the economy, but quality downgrades and the forced skimping do not carry the opposite effect. This way then they actually measure the cost of a falling standards of living, but all the same it translates into their glorious GDP growth figures.
In addition to propping up the GDP growth figures, Paul Craig Roberts suggests that these peculiar reforms of inflation reporting are designed to hold down Social Security costs by denying cost-of-living adjustments to Social Security recipients. (We shall see below why this is such an important objective of the government).
The bottom line of this is that we cannot trust the US government figures on inflation and by implication its GDP growth figures. As inflation measurement is a huge enterprise requiring a vast amount of time and resources we would not know what the actual inflation is, but John Williams from Shadow Government Statistics gives a good idea of what the actual inflation could be. They calculate the inflation according to the methodology, which was employed by the government’s Bureau of Labor Statistics prior to 1990 before all the tricks following the “reforms” came to use. These alternative inflation statistics indicated (Table 6) that the actual inflation was about 2 percentage points above the officially reported until 2007, after which the gap widened to a persistent level of 4 percentage points.
Alerted by the alternative statistics, John Williams questions whether there has been any real growth in the US economy since the 2008 crisis. Williams believes that the GDP growth rate is an illusion resulting from the understatement of inflation.
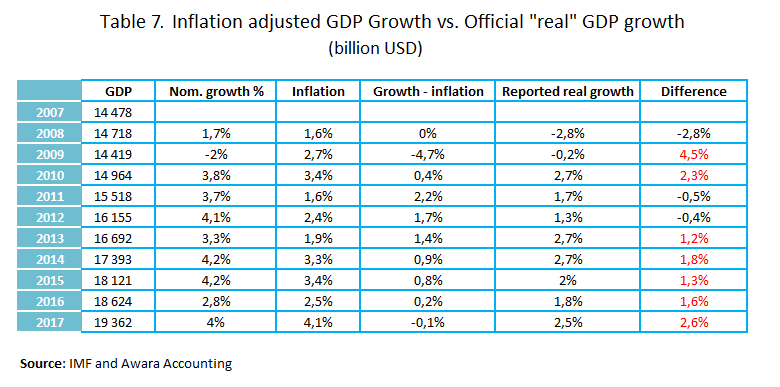
We tend to agree. But things get yet more bizarre when we realize that even the official inflation figures don’t tally with the reported GDP growth. We subtracted the officially reported inflation from the nominal (not adjusted for inflation) GDP growth for the year, and then compared the result with the officially reported “real” GDP growth. In 7 of the 10 years surveyed, the “real growth” was substantially higher than the nominal growth minus official inflation (Table 7). This is mindboggling! We have no idea how the government would explain this conundrum. So, that was what our calculations yielded by using the government figures. Now, allowing for the official inflation figures to be undermeasured, then there is really no real GDP growth left at all. (We note, that the nominal figures are the ones that are the most trustworthy, forming the basis for all the creative accounting interventions. Having said that, we must remember that even so they represent only assessments of the total value of the total output of all goods and services.)
Only massive borrowings has kept the US economy afloat
Not only has there been no real GDP growth but even the nominal growth has to a crucial extent been provided for by means of the enormous government borrowings. In order to understand the effect of the massive government borrowings on the GDP growth, we compared the annual growth of national debt with the GDP growth. (Table 8). The findings of this exercise are disturbing as it turned out that in every single year since 2007 up till now the amount of net borrowing exceeded the nominal GDP growth. In the peak crisis years 2008 and 2009, debt growth was a staggering 5.7 and 6.3 times that of the GDP growth. In all other years, debt growth remained at levels of two times the GDP growth, except 2014 and 2015 when they were on par.
What this shows is that the US economy has no capacity to grow on its own without being constantly fueled with ever growing amounts of debt. Remove the debt and the economy would be heavily in the red. With the alarmingly growing national debt, the US is rapidly approaching the absolute debt ceiling, after which debt would just not be available or in any case not at feasible rates. This then would leave the money printing press of the Fed as the only remaining creditor of importance, risking extreme inflation and terminal destruction of the remaining market mechanisms.
The extensive reliance on debt leverage is a common problem to all the Western countries. In its seminal study Awara Accounting exposed how massive new debt has hidden years of negative growth not only in the US but also the EU. The study revealed that the real GDP growth of Western countries has been in negative territory for years. Only by massively loading up debt have they been able to hide the true picture and delay the onset of an inevitable collapse of their respective economies.
US sustainable GDP is $10 to 14 trillion
The inevitable conclusion of this is that sooner or later (sooner) the debt will have to dry up and the US economic balloon will deflate and drop back to its sustainable GDP level. We cannot know what those levels could possibly be, but a good guess is that they would have to fall back to their pre-debt binge levels. For the US it would mean a sustainable GDP at the level of just above $14 trillion, the GDP of 2007. In fact, you could argue that they would even need to fall back to the level of 2000 when the GDP was just above 10 trillion. In a less dramatic scenario these sustainable GDP levels would be reached by the Japanese or Italian way, where the GDP just stays put without any growth for decades and falling behind other countries. The downside with this scenario is that it cements the problems while the necessary radical reforms to change the course would not be undertaken. For a superpower this in itself would be fatal.
At any rate, we think that the real productive capacity of the US economy is no more than $14 trillion in terms of GDP. This would give a per capita GDP of just above $30 thousand, almost on par with Russia’s present $28 thousand per capita.
A war budget wrapped in wishful thinking
Recently the Congress passed an omnibus spending bill, which wrapped up the budget for the current year (the fiscal year October 2017 to September 2018). The bill is designed to keep the military-industrial complex happy with massive increases in war spending (aka defense). But Trump’s core constituency is furious with the bloated budget and the swelling deficit. Their concern is well-founded in view of the dramatic news from just a week earlier about US national debt having risen above $21 trillion for the first time ever. That is an alarming one trillion dollars increase in just over six months since early September 2017.
This ties in with our above discussion about the already out of hand debt problem of the United States, but the situation becomes even more alarming when we factor in Trump’s budget for the 2019 fiscal year. The marketing savvy Americans like to brand everything, so they give (supposedly) catchy names even to budgets. Trump’s budget for 2018 was called America First – A Budget Blueprint to Make America Great Again. That achieved, the 2019 budget is more modestly called An American Budget, which is kind of logical considering it deals with the finances of the USA. But more so, having studied said budget, we definitely approve of the label American Budget, see otherwise the reader would be excused for mistaking it for Zimbabwe’s. Just as we hit on that parallel a Google search on news about the United States record borrowings – breaking the $21 trillion mark – landed us on an article titled Govt debt soars to $21 trillion. The only problem, the article was from 2005 and it concerned Zimbabwe. Whatever, a few more years of these budgets and the US might find it compelled to seriously start studying the Zimbabwean experience.
Even the American budget 2019 – which relies on extremely optimistic and unrealistic economic growth assumptions and numerous budget gimmicks – foresees enormous deficits to the tune of $1 trillion for each year up to 2023. (Note to the reader: as the budget is still just a blueprint the figures are changing from version to version). But then, then… the proverbial planning horizon of all prodigals and addicts…then from 2023 the miraculous road to recovery will commence, the deficits will go down year by year all the way to a virtually balanced budget in 2028 with a $363 billion deficit equaling just 1.1% of the GDP. And after that the United States will live happily ever after…
Seriously, the projected turnaround from 2023 is at best wishful thinking, and more probably window-dressing and a problem left to be tackled by future generations on the principle after me the deluge. However, it is much more likely that the present generation will get a rough wake-up call prompting them to deal with this fatal problem already within a few years.
Actual deficits will be higher
The independent think than Committee for a Responsible Federal Budget forecasts (Table 9) that not only will there be any turnaround in deficit growth (as the Trump administration and Congress projects) but the deficits will continue to massively grow reaching $2.4 trillion by 2028, which is closer to 7 times higher than the official prediction. Cumulatively over the 10 years, the CRFB projections would add $10 trillion to the debt over the government’s forecast.
Proceeding from the financial facts of the last decade, the present fiscal policies and the dynamics of US demographics and economy, we consider that the CFRB projections definitely point in the right direction.
We also predict that the actual deficits 2018 – 2023 will be significantly higher than what the Trump administration optimistically forecasts. Further, we surmise that the annual increase in debt will be considerably higher than the deficit and even higher for each year than the actual nominal increase in GDP. We already saw from Table 8 that this has been consistently the case for each year 2008 to 2018. Considering this, we assume in our baseline scenario that the US government’s annual net borrowing needs will exceed the nominal GDP by 3%. This would mean that the net increase in debt could be as enormous as $10 to 15 trillion in just five years 2019 to 2024. Such massive borrowings would be ruinous for the economy. It is hard to imagine that the bulk of the funding could come from anybody else than the Fed (directly or indirectly). These levels of debt leverage would permanently detach the economy from all conditions of market economy, with dire consequences for the future.
Social Security puts the government between a rock and hard place
The proposed size of the US federal budget for 2019 is $4.2 trillion, and according to the government’s 10-year projection the budget would further balloon into $6.3 trillion by 2028. While military spending makes up a huge and growing share of the federal budget, it might come as a surprise to many that it actually is social spending, which forms the biggest portion of the present budget and will to grow vastly more than the military spending.
Table 10 shows the amounts and shares of the main areas of spending in the 2018 budget and the projected budget a decade later in 2028. In a decade, the already bloated war budget would go up from 634 billion to 783, but its share of the total would decline from 15% to 13%. (Who lives will see).
The above figures are from the budget plans floated before the omnibus spending bill was passed in March, which already altered the picture a bit, handing a new massive win to the military-industrial complex. Nevertheless, for the purpose of the present argument, these graphs serve their purpose.
It is important to understand that the 2028 figures represent only a sketchy outline of where the US federal budget might be in the case President Trump would have the chance to implement his policies. However, as we pointed out earlier, we cannot actually be sure that even Trump and his administration take those figures seriously. In truth, we are inclined to think they don’t. Whatever, it is clear enough that the US economy is faced with enormous hardships. The pension costs (customarily referred to as Social Security in US budgeting practices) will continue to grow at an alarming pace together with skyrocketing health care expenditure, even after the partial repeal of the Obamacare legislation and all the bravado about additional savings.
To properly understand US government budgeting, one must bear in mind that the US federal budget system rests on two pillars referred to as mandatory and discretionary spending. The framework for mandatory spending is set by laws which expand into the future, while the discretionary spending budget is passed on an annual basis. This is also the reason why the latter always gets more media attention, although it is the far smaller part of the total budget, in 2018 the proportion being 30/70. Due to the media attention, people are misled into thinking that the discretionary spending actually is the total US budget, and that therefore military spending – contained almost exclusively in the discretionary part – would make up over half of the total US budget. In fact, in the 2018 budget, pensions accounted for 24% of the total or $987 billion, whereas they now are projected in the multi-year plan to grow by 77% to reach $1,748 billion by 2028 with a share of 28%. The health care costs with a present share of 24% worth $982 billion would in the same time jump by 89% to $1,854 billion, a share of 29%.
Say hello to unfunded liabilities
The ballooning social security and health care costs will not come due to some newfound social inclinations in Trump’s way of thinking, rather there is no choice. It is true that it is politically more difficult to address the mandatory spending part of the budget, but it does not mean that it is set in stone, congressional majorities could curtail that spending if it were deemed feasible. But the problem is that there just is a growing number of retired people who must be fed and provided with health care at the same time as the cost of living is growing at an alarming rate.
In this connection, we are reminded about the rigged inflation measures discussed above and its implication on denying social benefits increases. A desperate attempt to keep the fiscal problem under lid.
We reported above that the social and medical funds are among the government’s biggest creditors, but we also pointed out that those funds are now drying up as Social Security has been running primary cash deficits since 2010. And it promises to get rapidly worse as the unfunded liabilities scare now starts materializing in earnest. By the government’s unfunded liabilities economists mean promises that the government has given for future pension and health care pay but without actually having put aside the required funds. The original idea when the funds were set up was that these liabilities were to be funded by means of the federal insurance contributions (FICA), which are deducted from monthly paychecks. But the problem is that in reality social security operates on a pay-as-you-go basis, meaning that the current revenue pays for the current benefits without the money being funded for future needs (the way a private pension plan would work, in theory).
Social Security has been kept floating notwithstanding the cash deficits since 2010 by interest income from its investments (mainly treasury bonds). But barley hovering above the breakeven point with a total surplus of $15 billion in 2017, the system is now expected to go permanently into absolute deficits for the foreseeable future. The Medicare trust fund is projected to run out of money in seven years, Social Security Disability in five, and Social Security retirement in 12, according to the nonpartisan Congressional Budget Office.
Economists have calculated that the value of the unfunded liabilities on Social Security and Medicare range anywhere between $46.7 trillion to $210 trillion. The calculations are based on assessing the difference between the amount of the present value (their discounted value as of today) of all benefits which will have to be paid out in the future years and the present value of the projected tax revenue designated to pay for those benefits. It is worth pointing out that the $46.7 trillion unfunded liabilities figure is not based on just any economist’s alarmist calculations but actually comes from the official Financial Report of the US Government for year 2016 compiled by US Department of Treasury. (There exist yet other pension and health care funds that further add to the liabilities, such as those for military and civil service retirees and assorted other groups).
For the sake of the present argument, we do not even have to consider the $210 trillion unfunded liabilities scenario, but you might want to look it up here. The present path of permanent deficits and the prospect of facing a $46 trillion deficit is bad enough for us to realize that the government cannot count on Social Security to continue funding its deficits and that there is very little, if any, leeway to cut the spending – as it, on the contrary would have to be stepped up. Given this level of dependence, trimming benefits to help keep the system solvent, will be virtually impossible.
Evan as it is, Social Security would in the best case provide only for a for a meager basic income, it having been designed only to replace about 40% of the average worker’s pre-retirement income. The health care system, Medicare, with deductibles and copayment also add up to sizeable amounts. Experts assess that most people, would need 70% to 80% of their previous work-age income to cover their senior living costs, and many retirees require even more. A big portion of the retirees, would traditionally have retrieved that other half of the needed income from their private pension plans. But the quantitative easing and extremely low interest rates have distorted the market to the extent that the yields on private pension plans have not been able to keep up even with inflation. As a result of the ultra-low yields, the retirees have been forced to cut down on the annual withdrawals from their funds or else face the risk that the funds would dry out altogether. Correspondingly, present working age population already face difficulties in building up their voluntary retirement funds due to actual unemployment (i.e. the low job participation rate), lower real wages, the inevitable accelerating inflation and rising taxes (which inevitably will come notwithstanding the recent budget-busting tax cuts).
Interest costs deliver the final blow to the US budget – and the whole economy
But as if that would not be enough, there’s one more looming catastrophe, the precipitously rising interest costs. According to the 10-year projection, the budgeted interest expenditure is due to rise from $310 billion in 2018 to $859 by 2028. Interests would then make up a larger portion of the budget than the projected military costs. But it could get yet much worse than that as there is no telling how high the interest rates could actually go by then. The CRFB recently estimated that under current projections, rising debt and interest rates will lead the federal government to spend $6.8 trillion on interest costs over the next decade. But according to the CRFB if interest rates end up just one percentage point higher than projected, interest costs would increase by a further $2 trillion. And yet, if interest rates were to return to their pre-recession levels, costs could rise by $3.4 trillion (over the decade). With the rising interest costs the deficit will widen and the debt grow further. Within the framework of the present government projections, that would mean an interest expenditure at the level of $1.3 – $1.5 trillion in 2028, almost the double of what is officially projected. In any case, the CBRD estimates that the interest cost in 2028 – both in absolute dollar terms and as a share of GDP – would reach a historic record. (Under their scenario, interest costs in 2028 would total 5.2 percent of GDP out of a total deficit of 7.6
The trend of rising interests is very real. The Fed raised the federal funds rate to 1.5 – 1.75% this March, while all through December 2008 to December 2015 the rate was down to 0.25% or effectively zero. Before that, the lowest fed funds rate was 1.0 percent in 2003, which was set to combat the 2001 recession. In June 2017, the Congressional Budget Office projected that the three-month Treasury rate will increase to an ultimate rate of 2.8 percent while the ten-year Treasury rate will increase to 3.7 percent. The pre-recession interest rates were at a level of 4.5 – 5%, but the 1980s saw long periods of interests above 10 or even 20%, which were applied to curb runaway inflation. Trade wars and increased military tensions combined with an arms race and blockades could very plausibly again lead to such inflation and rates.
According to our research, things could get even worse than that in view of all the negative factors facing the economy, as discussed in the present report. Economic growth could be less than the projected growth, and in view of our findings that there has not been any actual growth at least since 2007, it is more likely than not that the economy will continue not to grow. The question is rather will the government be able to continue creating a semblance of growth. It is quite plausible that the government will just go on rolling the actual accumulated GDP losses from year to year. Under such scenarios, the deficits would further widen causing a more rapid deterioration of the debt-to-GDP below sustainable levels. – Finally, this could (and most probably will) lead to a complete meltdown of government finances and a financial and economic crisis. Such a crisis of epic proportions would lead to the debt – following asset values – being wiped off and the American inflated economy being cut down to size.
The military budget first of all
The $1.3 trillion spending bill that the US Congress passed in March to cover the rest of the 2018 fiscal year allocates $700 billion to Pentagon. For fiscal 2019 the military has been promised $716 billion.
Speaking volumes about the inefficiencies and corruption, around half of the war budget now goes to contractors. In the words of William Hartung a huge chunk of that budget “goes directly to private corporations and much of it is then wasted on useless overhead, fat executive salaries, and startling (yet commonplace) cost overruns on weapons systems and other military hardware that, in the end, won’t even perform as promised. Too often the result is weapons that aren’t needed at prices we can’t afford. If anyone truly wanted to help the troops, loosening the corporate grip on the Pentagon budget would be an excellent place to start.” Further in Hartung’s report we read that according to the Federal Procurement Data System’s top 100 contractors report for 2016, the biggest beneficiaries were Lockheed Martin ($36.2 billion), Boeing ($24.3 billion), Raytheon ($12.8 billion), General Dynamics ($12.7 billion), and Northrop Grumman ($10.7 billion). – That means, that just five firms gobbled up nearly $100 billion of the budget.
The military budget includes also a special provision of $78.1 billion for financing the ongoing open wars in Iraq, Syria and Afghanistan.
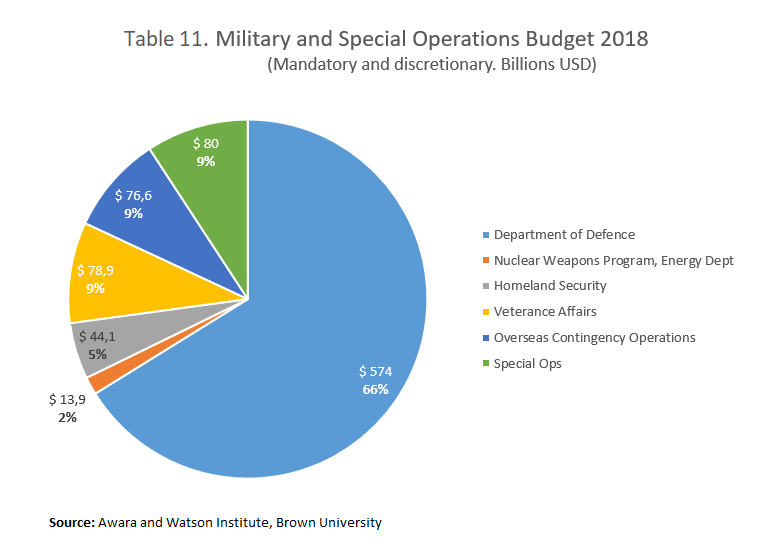
On top of the military budget US war capabilities and surveillance and interferences at home and abroad are beefed up with approximately $80 billion earmarked for the FBI, CIA and the other 16 surveillance and special operations organizations. We assume, that in addition to the budget figures that are in the public eye, these agencies get special financing, perhaps directly from the Fed and through various illicit activities. The total military and special operations budget (including both mandatory and discretionary spending) amounts to $867 million (Table 11).
Everything else is being offered on the altar of war spending
As Social Security and Medicare costs are about to skyrocket, interest expenditure out of control, and the ruling elite being obsessed with wars to maintain and expand their global hegemony, all other areas of spending are being thrown overboard. In Trumps multi-year plan the share of non-defense discretionary spending (NDD) will see its share of the total discretionary spending continuously shrink. The value of NDD spending was $636 in the budget proposal for the fiscal year 2019, but by 2028 the total NDD spending would be down to $436 billion. So, not only does the multi-year plan not foresee any normal increases to adjust for inflation it actually cuts the NDD budget by 45% in absolute terms. Considering inflation, the cuts in real terms would be closer to 70%. NDD spending goes toward areas such as education, scientific research, infrastructure, national parks and forests, environmental protection, poverty alleviation programs, and public health, foreign aid, as well as many basic government operations including law enforcement, courts, and tax collection. – But as the military-industrial complex is the sole priority, these concerns will be set aside.